Monday, July 27, 2020

Thoughts on the Pandemic from an Engineer and Teacher


A slightly-shortened version of this article appeared as a board of contributors article in the Sunday 26 July 2020 Waco Tribune-Herald newspaper.

---------------------

There's been talk about Sweden's experience fighting the Sars-CoV-2 pandemic.  Sweden used less restrictive quarantine measures and saw higher rates of infections.  I have seen this result argued both ways.  But none of those making claims consider the timing.

It's not just the measures taken,  it's also the timing of when those measures start relative to the viral "invasion".  Sweden was aware of the problem,  and started its measures early in the viral invasion process. 

Starting early enough has a tremendous effect at "flattening the curve".  The not-so-strict nature of Sweden's measures show up in the slightly-higher infection and death curves relative to its neighbors,  who took stricter measures,  but also started early. And that's the true comparison.

That is not "sound-bite simple",  but it is just not very hard to understand.

New York state on the other hand got started later in the infection process with its very strict measures.  The lateness of the start is why their measures were just barely effective,  and the curves for infections and deaths very nearly swamped their capabilities to handle it. 

So why did New York get started so late?  Because at that time,  the federal government as embodied by the Trump administration was still decrying this as a Democrat hoax,  and still claiming it was no worse than any other flu.  You have all seen the video footage of Mr. Trump and others saying those things,  along about February and March. 

These lies (not just "mixed signals",  but out-and-out lies,  if one is truly honest about it) coming from the White House meant that New York,  California,  and Washington state got started too late,  in their confusion over guidance.  So their infection rate and death rate curves all spiked up very high. 

Eventually,  the CDC experts got heard,  and after too long a delay,  the "Trumpsters" in the White House finally admitted this disease was a real problem.  Yet the far-right/alt-right component of their political base is still even today circulating lies and conspiracy theories about this virus,  including deliberately stirring up erroneous claims of "my right not to wear a mask is absolute". 

And it is the resulting misbehavior by individual citizens,  of deliberately not wearing masks to prevent disease transmission (traceable to that third-to-a-half of the population that still likes Trump no matter what),  which has caused the disastrous resurgence of the disease across the south and southwest of the US. 

The claim of an absolute right not to wear a mask is based on a premise that is demonstrably false,  so the conclusion is false as well.  It is based on the notion that the mask is worn to protect the wearer from infection,  and that his choice does not affect anyone else. 

That is just dead wrong scientifically!  The mask protects those around the wearer from being infected by the wearer,  which is important,  because most of those spreading the disease do not know they have it.  Thus the choice not to wear a mask can have life-threatening consequences for all in the vicinity.  It is simply not allowed legally,  to threaten the lives of others,  in other circumstances;  this is no different.

Want proof of the disease-spreading connection to all the lies that came from the far-right/alt-right?  Most of the states seeing the worst resurgence are so-called "red" states.  As Gomer Pyle would say,  "Surprise,  surprise!"  And we have recently seen where loyal Trump-supporting governors are at odds with the mayors in their own states,  over those governors' refusal to order mask-wearing. 

It is wrong to pitch this politically as a stark binary choice (close down to save lives,  or open up to save the economy),  because we have learned a lot since this pandemic started.  There is no reason most businesses and other activities cannot reopen,  if disease transmission can be prevented!  But it usually requires changes in HOW they do whatever it is they do,  to accomplish that. 

The only tools we have to employ are masks,  the 6-foot rule,  gloves,  disinfection in multiple forms,  and for the more extreme cases,  PPE like face shields and suits.  There are some businesses or activities that cannot effectively limit disease transmission:  those must remain closed.  And there's no way around that ugly little fact of life!

Schools as we have known them may be one such that have to stay closed.  It's not the classrooms,  those can be "fixed" by limiting class sizes to about a third of what we have traditionally used,  in order to have the room to space everybody out 6 to 8 feet in all directions. 

The school boards are going to balk at doing this because of the money:  3 times the teachers and a lot of portable buildings needing HVAC will cost a lot. So,  at local election time,  you have to remember who valued lives over money,  and who valued money over lives. It's a moral choice.

Up to about 6th grade,  if you can get them inside their classrooms instead of congregating in the schoolyard before school starts (and after it ends),  you can stop disease transmission between kids.  School buses are another bad problem,  though,  and also very expensive to solve.  To space out where the kids sit on the bus,  you will need a whole lot more buses and drivers.  Once again,  this is very expensive to actually do.

But the school lunchroom will be very difficult to change.  You have to space-out all the tables,  the chairs around those tables,  and all the line-standers.  You simply cannot have the giant dense crowds in the lunchroom,  that have been so traditional up to now!  It'll cost!  And lunch hour won't be short anymore.  Which means you will have fewer teachers around to police it.  They'll be teaching classes.

So also it will be expensive to stop disease transmission during recess,  sports,  and extracurricular activities.  It can be done,  but you must pay to do it!  Locker rooms and stadium seating are the hardest to remedy.  But band halls and science labs are problems as well.

From about 7th grade on up,  the students don't stay in the same classroom all day anymore.  The halls are very densely crowded shoulder-to-shoulder every 45 minutes or so,  as they change from class to class.  That simply cannot be allowed,  if disease transmission is to be prevented!  Period! 

I don't have the answer to that one,  but it is very clear indeed that we need a whole new way of conducting and scheduling our junior high and high school classes.  That change-classes crowded-hallway picture just cannot be allowed! If you cannot change that,  best to stay closed!

With the start of school only a few weeks away,  I do not see how all this can be adequately addressed.  Yet it must be,  as soon as possible.  Why?  Because distance learning is a poor substitute for interactive in-classroom learning.  It is no substitute at all,  for folks with poor access to the internet,  which is way too widespread in this country.


Saturday, July 25, 2020

Taking Care of Car Batteries

The batteries in nearly all cars,  most tractors,  and most lawn and garden equipment,  are lead-acid storage batteries,  whose primary function is to start the engines in these devices.  This article deals with that kind of battery,  for those kinds of applications.  The most common type are nominal 12-volt batteries.  There are still a very few,  very old cars that use 6-volt batteries,  and a very few tractors indeed,  that use 8-volt batteries.  What I have to say here applies to all of those.


Tools

You will need more than just a voltmeter to understand what is going on with your vehicle and its battery,  and the system that charges it.  But you don’t need much,  and you don’t need the latest-and-greatest,  most-expensive tools.  Figures 1 and 2 show images of the very simple,  and rather inexpensive,  tools that you need. 

Figure 1 shows a small,  inexpensive battery charger nominally rated at 6 amps,  and it also shows a very simple and inexpensive battery load tester.  Figure 2 shows a small generalized wire brush,  and a battery terminal-type of wire brush,  plus a commonly-available chemical that has proven effective for reducing corrosion on the steel nuts and bolts that secure your battery clamps. 


Figure 1 – Small,  Inexpensive Battery Charger and Load Tester Devices


Figure 2 – Two Styles of Wire Brush,  and a Common Chemical That Cleans Corrosion From Nuts and Bolts

The chemical was intended to clean hard water deposits and corrosion from household plumbing items.  However,  it does serve our purpose here,  which is to clean corrosion deposits from the nuts and bolts of our battery cable clamps.  And it works rather well for that.  It is a poisonous chemical,  so be sure to take care not to expose yourself,  anyone else,  and especially children,  to it. 

Problems Usually Encountered

What usually draws one’s attention to batteries and charging systems is a failure to start when you turn the key to “start”.  When it works,  you never give it a thought.  When it doesn’t,  you are stumped,  unless you have the right tools,  and you also know how to use them. 

There are two reasons that a battery might not start an engine: (1) it is discharged,  and (2) it is “bad”.  Those two are not the same thing.  Get out your load tester and hook it up.  If the battery tests “weak”,  it could be either bad or discharged,  you don’t know which (yet).  If it tests “good”,  your problem lies elsewhere. 

You do this initial test by hooking the load tester positive cable lead to the positive pole on the battery,  and the negative lead to the negative pole.  Immediately,  you will see the needle read a voltage.  This is because the load tester is a voltmeter,  wired in parallel with a load resistor sized to draw a large current from the battery.  You have to activate the test switch to hook-in the load resistor,  however.

A 12 volt battery ought to read 12.0 to at most 12.6 volts at no load.  A 6-volt battery ought to read 6.0 to at most 6.3 volts at no load.  An 8-volt battery ought to read from 8.0 to at most 8.4 volts at no load.  The usual no load that values I see on otherwise-charged batteries are about 12.2 volts,  6.1 volts,  and 8.2 volts.

If you see a no-load voltage 2 or more volts below what you should see,  you are “done”:  you have a bad cell in your battery.  Go get a new one.  Simple as that.

If you see a voltage that falls in the range of what you should see,  then hit the load test switch on the load tester,  and hold it there for 5-10 seconds.  The voltage will drop as long as you hold the load switch,  but hopefully it will not drop too far.  The scale on the load tester dial in Figure 3 shows how much voltage drop you can tolerate.  It has “good” and “weak” ranges marked,  for both 6 volt and 12 volt batteries.  The red “replace” range is also shown.  “Weak” means you replace it very soon. “Replace” means you replace it right now.

That loaded-voltage drop is almost 2 full volts on a 12-volt battery,  about 1 full volt on a 6-volt battery,  and although there is no indication on the load tester scale shown,  about 1.3 volts on an 8-volt battery.  If your voltage drop is bigger than what you should see,  either your battery is discharged,  or it is no good.  You must now find out which possibility is true.


Figure 3 – The Scale on the Battery Load Tester

If you have been running the engine within the last few hours,  and you also know your charging device (usually an alternator these days) is good,  then you know your battery should be charged as much as it can be. If it has failed the load test under these circumstances,  then it has to be “bad”.  Replace it.

Otherwise,  drag out your small battery charger,  and put the suspect battery on “charge” at 3-4+ amps for about half an hour.  Put the positive lead of the charger on the positive pole,  and the negative lead on the negative pole.  Be sure the volt switch is set to the appropriate 6 or 12 volt setting for that battery.  Then plug in/turn on your charger (as applicable).  Before you walk away, look at how much current it initially draws. 

If the initial current is near the nominal max for the charger,  you have at least some confidence the battery might not be totally “bad”.  That current should drop a little bit (from near 6 amps to near 3-4 amps) during your half hour of attempted charge.  However,  faster current drops are more likely to indicate that the battery really is “bad”.

8-volt batteries are a bit odd,  and most cheap battery chargers are not set up for them.  Initially,  start out using the 6-volt switch setting,  to keep the initial charging current within the operating range of your charger.  It will start out a bit low on current.  Later,  when the current has dropped significantly further,  go to the 12 volt setting,  which will increase the charging current.  As long as it is within an amp or so of the nominal current rating of the charger,  you are OK. 

If you have a battery with filler caps,  loosen them before charging,  so that the produced gases get to leak easily out of the battery,  without pressurizing the battery.  If not,  you need to stay at charging currents under about 3-4 amp,  no matter what.  You set the battery voltage lower with that switch,  to control that charging current to tolerable values.  That 3-4 amp current restriction applies to all of the sealed battery types.  You risk a battery explosionif you fail to heed this warning

If your charging current starts out low (2-3 amps),  and the battery either holds that charging current,  or increases charging current very slowly ,  as time goes by,  your battery is most likely totally “bad”.  That’s not to say you can’t still charge it up (over several hours) and successfully use it for a little while yet,  but its useful life is now quite limited!  Start looking for a new one!

Once you have about half an hour of charge,  at 3+ amps,  into the battery,  try the load test again.  If it fails,  the battery is “bad”,  just replace it!  If it passes,  you can try to start your engine and go about what you were trying to do,  except that you have to worry about why your battery was discharged!  And it WAS discharged!  Now you know that! 

Starter motor failures I am not going to cover here,  except to say that if you short the big battery wire to the solenoid start terminal with a screwdriver,  and it tries to start,  the starter motor is NOT your most fundamental problem!  Bad connections,  or a burnt/broken wire or bad starter relay (if so equipped,  and most are these days) can be.  And if you have to ask how to do this starter solenoid short test,  you need to seek professional help anyway. 

The next most obvious thing to check is the condition of the cable connections at the battery.  If these are corroded (or loose),  it restricts current from the battery to the starter,  and it restricts current to the battery from whatever charging device the vehicle has.  Enough current restriction,  and you have first have a charging failure,  and then a start failure because of a discharged battery.  The corrosion deposits are blue-to-white crusty-looking crap on the battery cable connections.

Fixing the Problems

Loose connector bolt torque,  you can check with a wrench of the right size for your connections.  In a side post battery with multiple cables to a single connection,  this loose connector thing is a very common problem!  Everybody else,  not common at all.   But worth checking,  in any event. 

To fix corroded terminal connections,  you need to remove the battery cables (negative first on negative ground systems),  and wire brush them clean.  The cylindrical battery terminal cleaner in Figure 3 gets this stuff off the top-mount battery posts,  and the small wire brush cleans it off the lead-based top-mounted battery cable clamp assemblies,  and also side-mount terminals.  It’s slow,  take your time. 

It is wise to remove the bolts and nuts from your battery cable clamps, and submerge them in the CLR concentrate,  in a small glass vessel,  if possible.  I usually leave them overnight,  and they look pretty good the next day.  Wash them with water before re-installing. Reinstall the positive cable first,  then the negative (except for the very rare-indeed positive-ground systems).

If your battery and your starter both test good,  then cleaning corrosion deposits off the connections on the battery usually fixes most starting problems.  If not,  then you may well have a bad starter relay.  These are not all that expensive.  Just buy a new one and install it.  Most likely,  that will then fix your starting problem.  Every vehicle is different in what these look like,  and where they are mounted.  Try the internet for images relevant to your specific vehicle or machine. 

About the only other problem I have ever seen is a bad wire from the key switch or starter relay,  down to the starter solenoid connection on the starter.  As these wires age,  they can no longer carry the required current.  They get hard and resistive from overheating,  which limits starter solenoid current,  and that causes start failures.  Just replace the bad wire with a new one that is a bit larger. 

Testing the Charging System

On most cars today,  this is an alternator.  Some very old cars,  it may be an old-time generator.  For most magneto-ignition lawn and garden equipment and some old farm tractors,  this charger is built into the magneto that drives the ignition.  Whatever it is,  it has to generate a voltage that is at the very least 1 volt above,  and no more than 2-something volts above,  your basic battery voltage.  3 is too much.

All you need to do is use your battery load tester as a voltmeter with the engine running.  Make sure that your engine-running voltage is at least 1.0 and no more than about 2.5 volts,  above your charged battery terminal voltage with the engine stopped.  With an alternator,  this set of criteria is true,  even at engine idle speed.  That is what the upper increments show in Figure 3 (marked “low”,  “OK”,  and a “red” range).  This particular tool shows only 6 volt and 12 volt ranges. 8-volt is “in-between”,  and about a third of the way up between the 6 and 2 volt ranges.  Just read the volts scale.

With a generator or a magneto,  the idle speed charging voltage may not be adequate.  Speed the engine up,  into the low end of the operating rpm range (usually around 1500-2000 rpm),  to test that charging voltage increment,  if you have an old-time generator or a magneto system.  If it still fails,  you will need a new alternator,  a rebuilt generator,  or a rebuilt magneto,  as applicable.   The closer this voltage increment is to 2.0-2.5 volts than 1.0 volt (for a 12 volt system),  the more confident you can be in that test result being a “pass” for your charging device.

That charging voltage increment over battery voltage also depends upon the basic battery voltage.  At 6 volts,  the min to max increment range is closer to only 1.5 volts.  For an 8 volt system,  it falls between that and the 2 volt range of a 12 volt system,  at about 1.7 volts. 

Time In Service

This varies strongly with whatever you paid for the battery.  Longer life is more expensive.  It is usually marked somewhere on the battery what the “guaranteed” life is to be.  There is also usually some sort of indication of when the battery was purchased.  Failing that,  I usually use a paint pen to mark purchase date and expected life on the batteries that I buy.  They very rarely last longer than the guarantee,  these days. 

If you are not sure what the load test really reveals,  but you are sure the battery has exceeded its guaranteed life,  then the wisest choice is to presume it has gone “bad” from old age.  Just buy a new one.  It is just not worth the trouble to “coddle” an over-age battery any further than when it first shows signs of failing.

Exclusions

None of this advice applies to anything but lead-acid batteries used to start engines.  Batteries that power hand tools,  and batteries used in hybrid vehicle propulsion,  are SPECIFICALLY EXCLUDED from this discussion! 

Routine Maintenance

If you have filler caps,  then open them every several months to a year,  to check fluid levels in the cells.  If they are low,  refill them to the mark with clean,  pure water.  Use distilled water,  if your local water supply is mineralized.  If your water is “soft”,  then tap water will serve as well as anything. 

Otherwise,  there is just not very much to do,  except keeping the corrosion crud off the connections.

Be sure to put an idle battery on charge every so often,  if it sits for months at a time without any use.  They do self-discharge over time (3-6 months max).   Keep the charging current low (under 4 amp).  Charge for around 12-24 hours,  but no more.


Thursday, July 16, 2020

The White House vs Fauci


The President’s track record leading the country through this pandemic crisis is,  shall we say,  NOT stellar.  It has been a long time since Dr. Fauci has actually even been seen at an official White House function,  and here of late,  White House advisors have been bad-mouthing Dr. Fauci in public. 

There is a prior track record of that from Mr. Trump himself,  despite his claims to the contrary in his most recent press conference.  And yet it is Dr. Fauci that tells us the truth about this crisis,  when the White House will not.  I certainly would be more likely to believe what Dr. Fauci has to say,  by far. 

So,  I came up with this.  You may download and use it,  if you wish.  It needs to be seen at every political rally from now to the November election,  including on the faces of protestors at Trump rallies.


Wednesday, July 15, 2020

Another Milestone


On 14 July 2020,  I hit 70 years old. My wife found the perfect birthday card for me.  I have to share it. 

Front outside:


Inside:


All I can say is,  the research continues.

Monday, July 13, 2020

Non-Direct to the Moon with 2020 Starship


This is a report of my follow-on efforts after the Moon Direct evaluations of “2020 Estimates For Spacex’s Starship to the Moon”,  7-5-2020,  this site.  That effort showed 
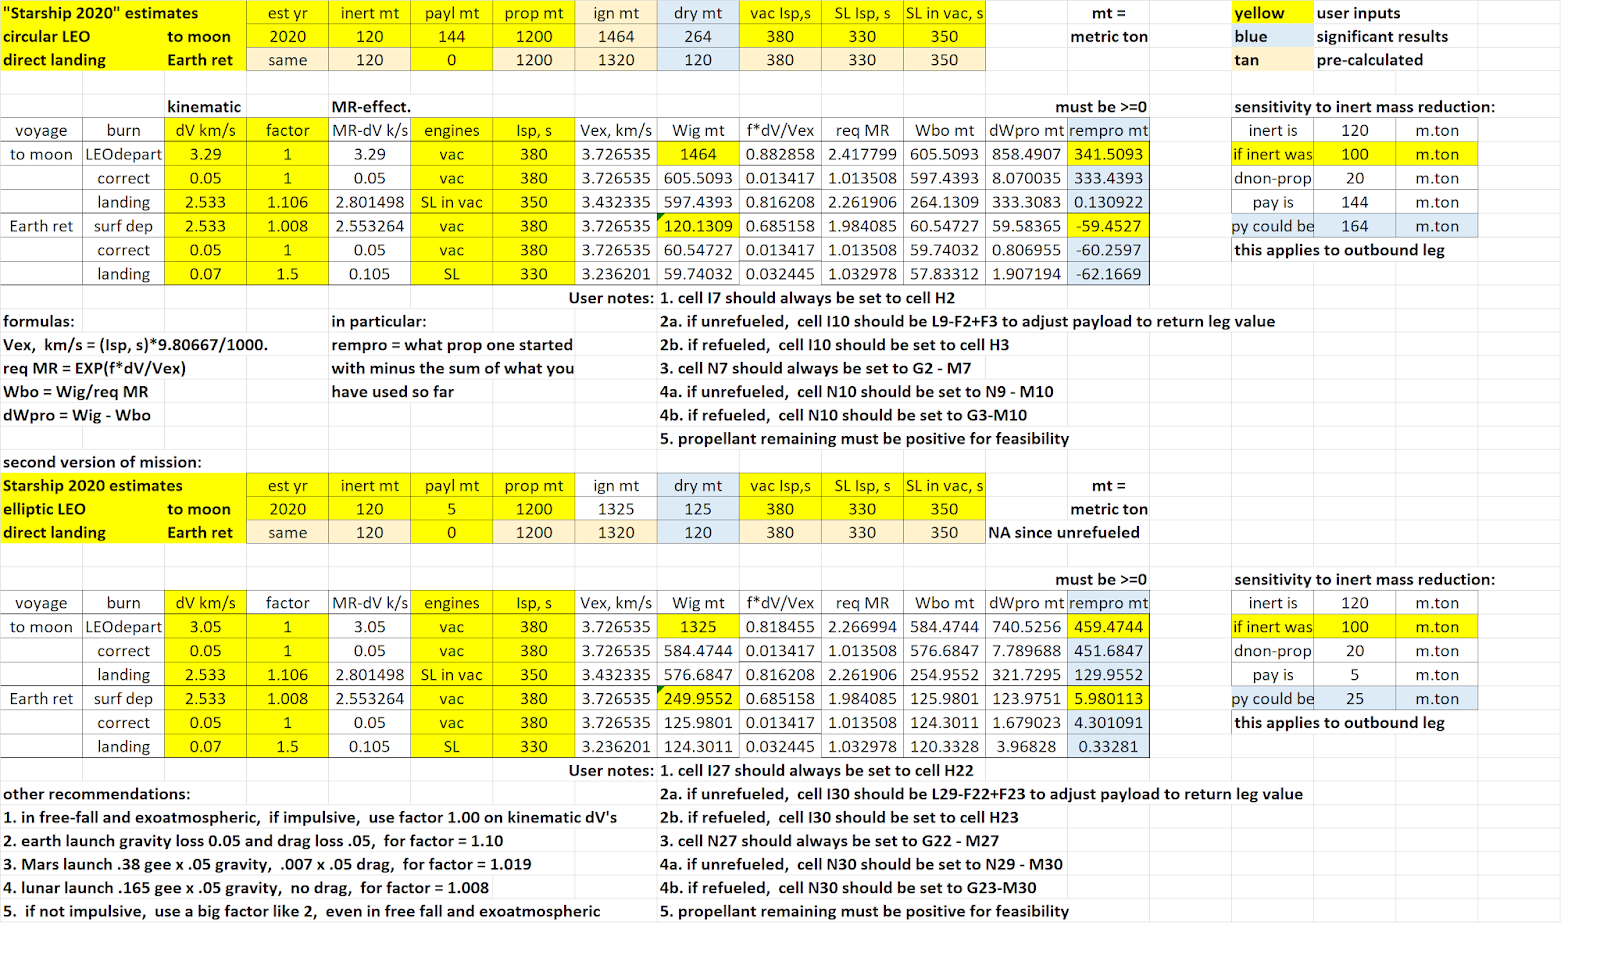
very clearly that the unrefueled delta vee for a round trip direct to the lunar surface is beyond the mass ratio capability of this vehicle design,  as it is currently understood in terms of posted data and public presentations.  This effort looks at refueling in lunar orbit,  either before,  or after,  the surface landing.

Source Data:

I got most my data from the Spacex website,  regarding their 2020 thinking and their performance projections for Starship and its Raptor engines.  Inert structural mass data is missing from that website,  so I got that from Elon Musk’s presentation in front of one of the prototypes at Boca Chica.  All that is documented in articles posted on this site.  That list is now as follows:

7-5-2020  “2020 Estimates For Spacex’s Starship to the Moon”  (direct to the moon)
7-5-2020  “How the Spreadsheet Works”
5-25-2020 “2020 Reverse Engineering Estimates for Starship/Superheavy”
7-3-2020 “Cis-Lunar Orbits and Requirements”
6-21-2020 “2020 Starship/Superheavy Estimates for Mars”
10-22-2019 “Reverse Engineering the 2019 Version of the Spacex Starship / Super Heavy Design”

What Was Analyzed:

Trips to the moon can start from either circular low Earth orbit (LEO) or an elliptical LEO.  That elliptical option increases perigee speed,  so that departure delta-vee is reduced,  at the cost of increasing the delta-vee required of the second stage to reach LEO from launch,  as indicated in Figure 1.  The eccentricity of this elliptical option is limited to apogee altitudes that are not far into the inner edge of the Van Allen radiation belts.  For this analysis,  I took that limit to be 1400 km (900 statute miles).  The circular LEO I took to be 300 km altitude,  and used that same altitude as the perigee of the elliptic option.

Once in the vicinity of the moon,  the easiest entry into low lunar orbit (LLO) is the figure eight trajectory into retrograde motion,  as indicated in Figure 1.  Circular LLO altitude I took to be 100 km,  approximately the same as for Apollo.  The entry into this orbit has a delta vee no more than 0.804 km/s,  unfactored,  as indicated.  Direct entry to a landing from this trajectory has at most 2.533 km/s delta-vee,  unfactored.  The unfactored landing from LLO has a delta-vee of 1.680 km/s.  Note that I used a bit more than surface escape,  and exactly surface circular orbit,  speeds for these transitions.  The surface values provide an approximation to the potential energy due to altitude,  as well as the kinetic energy,  which potential energy then gets included in the effective velocity.

If entry into LLO involves a rendezvous with something else,  then the vehicle making the rendezvous maneuvers must get into a slightly different orbit with a different period,  until the orbital positions line up,  then recircularize into LLO.  Already being so low,  the clear choice is elliptical with perilune at 100 km,  and apolune higher still. 

I picked an apolune altitude of 1262 km (center-to-center 3000 km) as a slight overkill,  with a period still short enough to be practical.  The axis of this orbit can be any desired orientation relative to the Earth-moon axis of the transfer trajectory,  as indicated in Figure 1.  But it does need to be co-planar with LLO.

The return in all cases examined leads to a direct aerobraking entry at Earth,  followed by Spacex’s “belly-flop” maneuver,  and a final deceleration to touchdown from a low altitude terminal fall velocity of 70 m/s,  per the simulations on the Spacex website.  This is also indicated in Figure 1,  along with the appropriate factors to convert kinematic delta-vees to mass ratio-effective values. 

All the in-space/in free fall factors are unity.  The three possible landings are factored differently,  reflecting factor 1.008 applied to the bulk of the burn to cover lunar gravity losses (no drag losses in vacuum),  with factor 2 applied to the last 0.25 km/s of the burn to cover hover and divert needs.  At Earthly touchdown,  factor 1.5 is applied to that burn to cover the hover and divert needs.


Figure 1 – Lunar Orbits and Delta-Vee Characteristics

The characteristics of the vehicle are indicated in Figure 2.  This is the Spacex “Starship” vehicle,  which is both the second stage for launch,  and if refueled in orbit,  the spacecraft for journeys outside LEO.  The figure depicts the cargo/passenger version most often depicted on the Spacex website.  It has pressurized accommodations in the nose for crew and passengers (blue in the figure),  followed by a depressurizable cargo hold for deliverable dead-head cargo (left clear in the figure).  The bulk of the vehicle volume is propellant tankage (orange in the figure),  depicted here without any details.

In the tail are 6 Raptor engines that burn liquid oxygen and liquid methane as the propellants.  3 of these are the sea level design with the shorter,  smaller expansion bell that works both at sea level and out in vacuum,  and the other 3 are the vacuum design with the larger,  longer expansion bell,  usable only in vacuum.  The 3 vacuum engines are essentially fixed in place,  while the 3 sea level engines are set to gimbal significantly,  allowing for considerable attitude control as they burn. 

Engine performance figures from the Spacex website are indicated in the figure.  These data match very well with earlier ballistic reverse engineering that I did on these engines.  For these analyses,  I presumed any landings required the sea level Raptors in order to get the gimballing for fine control.  I presumed the vacuum engines plus attitude thrusters would provide adequate control for takeoffs.

The mass characteristics are also indicated in the figure.  The Spacex website lists the maximum propellant load as 1200 metric tons,  and the payload as “100+ metric tons”,  without mention of the inert structural mass.  Musk’s Boca Chica presentation in front of one of the prototypes specifically calls out the 85 metric tons inert on one of his slides as an error.  That was the value from 2019 and earlier,  before the switch to stainless steel construction and the start of prototype manufacture and testing.  Musk now says the prototypes are running about 120 metric tons inert,  and he would be very happy if they could get that down to 100 tons. So I used 120 metric tons as “baseline”,  with 100 tons as a “goal value”,  in my calculations.

 Figure 2 – Vehicle Characteristics

Trajectory-wise,  I looked at 3 scenarios:  (1) just going to LLO without landing,  (2) refilling in LLO from tankers sent to LLO,  after landing on the moon,  and (3) refilling in LLO from tankers sent to LLO,  before landing on the moon.  Each of these was investigated for departures from circular LEO,  and from elliptic LEO.

Results Obtained:

For the trip to LLO,  I did add-in the delta-vee for rendezvous with “something” (perhaps a space station?) located in LLO.  However,  the cargo has to be off-loaded there in LLO and transferred to that “something” by means not contemplated yet.  None of it reaches the surface.  I did this for max propellant load at departure in LEO,  and determined the max payload masses that could be delivered and still have non-negative propellant remaining after landing on Earth.  Those results are depicted in Figure 3.

The deliverable payloads to LLO (from circular and elliptic LEO) both exceed what Starship/Superheavy can deliver to circular or elliptic LEO.  If the inert is 20 tons lighter at the goal value,  then the payloads to LLO are 20 tons heavier still.  All of these numbers are shown in Figure 3.  What one would really do is reduce the payloads to those deliverable to LEO,  then reduce the refill tonnages so that propellant remaining is just still non-negative after landing on Earth.  This helps reduce the tanker flight requirement in LEO.   For this scenario,  no tanker need be sent to LLO,  but no cargo is delivered to the lunar surface,  either.

 Figure 3 – Results for Visiting Only Low Lunar Orbit

The second scenario was to land upon the moon,  then ascend to LLO to refuel from a tanker (or tankers) waiting there.  If the payload delivered was low enough,  the Starship could ascend to LLO with non-negative propellant remaining.  As it turns out,  only one tanker was needed in LLO,  and the onus of rendezvous was placed on the tanker.  This tanker was an identical Starship,  flown at zero payload,  and with just enough propellant on board at departure to reach LLO,  make the rendezvous,  offload propellant,  and still return and land on Earth with non-negative propellant remaining.

The results shown in Figure 4 indicate that 59 tons of payload can go 1-way to the lunar surface from circular LEO,  and 80 tons from elliptic LEO.  Disappointingly,  both numbers are less than the website “100+ tons” figure.  In both cases 36 metric tons of propellant is required to get the Starship back to Earth with non-negative propellant remaining after landing,  because both payloads back to Earth are zero.  Only one tanker need be sent to LLO,  and it need not be fully loaded with propellant at departure from LEO.  The propellant load is a little higher for the elliptic case than the circular case,  but neither is a full load. 

This mission is feasible as indicated,  with two vessels sent to the moon (Starship to the surface and a tanker for it in LLO),  and a bit over 1700 to 1900 metric tons of propellant needed in orbit,  to send them there. 

 Figure 4 – Results for Refilling After Landing

The third scenario sends the Starship to LLO,  where the tankers must rendezvous with it there,  to refill it,  before it descends to the surface.  It offloads payload before escaping from the moon direct to Earth for entry and landing.  The tankers return from LLO to Earth entry and landing.  For this scenario,  I limited the payload to that which Starship/Superheavy can send to LEO (a bit less to elliptic LEO than to circular LEO).  I limited the refilled propellant loads in the cargo Starship to that required to reach LLO for refill,  with non-negative propellant remaining. 

After refilling in LLO,  Starship descends to the moon and offloads its payload.  Then it escapes directly to Earth.  The tankers return to Earth from LLO.   From circular LEO,  Starship can carry 149 metric tons of payload,  starting less than full of propellant from LEO.  It will need some 486 metric tons of propellant from 3 tankers that must rendezvous with it,  in LLO.   That’s a total of 4 vehicles sent to the moon,  fueled with some 3313 metric tons of propellant sent to LEO to refill them there.  These numbers are given as part of Figure 5. 

From elliptic LEO,  the plan is almost identical,  only the numbers change.  130 metric tons of payload gets deliveredOnly two tankers are needed in LLO to deliver 472 metric tons of propellant to the Starship there.  The starship lands,  offloads,  then escapes directly back to Earth.  The two tankers return to Earth from LLO.  There are 3 vehicles sent to the moon from elliptic LEO,  and some 2623 metric tons of propellant must be sent to elliptic LEO to refill them there. These numbers are also part of Figure 5.

 Figure 5 – Results For Refilling Before Landing

That summary is:

               Table 1 – Overall Results

Conclusions:

It will be difficult indeed to get Starship,  as we currently understand its likely characteristics in 2020,  to land on the moon without refilling somewhere near the moon before returning to Earth.  It is possible to deliver over-100 ton lots of payload to low lunar orbit,  but not to the surface,  without any refilling (except that in LEO before departure). 

It is possible to deliver under-100 ton lots of payload to the lunar surface,  with refueling after the landing,  in LLO from a single tanker Starship sent to LLO.  That will require less than 2000 tons of propellant ferried by tankers up to LEO, for the two vehicles sent to the moon.

It is possible to deliver over-100 ton lots of payload to the lunar surface,  with refueling before the landing,  in LLO from 2 or 3 tanker Starships sent to LLO.  That will require over 2500,  to over 3000,  tons of propellant ferried by tankers up to LEO,  for the 3 or 4 vehicles sent to the moon.

It is the change in inert structural mass for 2020 that drives this result,  despite the increase in max propellant load from 1100 to 1200 metric tons for 2020.  The 85 tons inert thought possible in earlier years has proven to be infeasible.   The 2020 thinking,  per Musk himself,  is 120 tons similar to the early prototypes,  with 100 tons as a desired goal.  This change in inert mass makes a huge difference in the achievable mass ratio out of the design,  much more so than the change in propellant load.

Details:

Images of the actual spreadsheets are given in the following figures.  Starship to LLO without any landings is covered in Figure 6,  for both the circular and elliptic LEO cases.  There are no tankers sent to LLO for this scenario.

The refill after landing scenario is covered in Figures 7 and 8.  Figure 7 shows the circular LEO departure option,  and covers both the cargo Starship and the 1 tanker Starship sent to LLO.  Figure 8 covers the elliptic LEO departure option,  for the cargo Starship and the 1 tanker.

The refill before landing scenario is covered in Figures 9 and 10.  Figure 9 shows the circular LEO departure option,  and covers the cargo Starship and the 3 tanker Starships sent to LLO.  Figure 10 covers the elliptic LEO option,  for the cargo Starship and the 2 tankers.

 Figure 6 – Spreadsheet Image:  Starship to LLO Without Landing

 Figure 7 – Spreadsheet Image:  Starship Refilled After Landing,  From Circular LEO

 Figure 8 – Spreadsheet Image:  Starship Refilled After Landing,  From Elliptic LEO

 Figure 9 – Spreadsheet Image:  Starship Refilled Before Landing,  From Circular LEO


Figure 10 – Spreadsheet Image:  Starship Refilled Before Landing,  From Elliptic LEO       

Update 7-18-2020:  Based on comments by reader Rok,  I looked at refueling the Starship cargo vehicle with tanker(s) after departing LEO,  during the transit to the moon.  For that to work,  both the cargo Starship and its tanker(s) must depart LEO simultaneously,  or else do a free-return abort back to Earth.  There is no major rendezvous maneuver allowable,  when two vehicles must be on the same trajectory.  They must essentially be within direct unaided human eyesight of each other.

In this scenario,  the cargo Starship leaves orbit with only enough propellant to depart,  plus ~ 20 ton abort landing allowance of propellant. It refuels on the way to the moon,  incurring some of the rendezvous delta vee (I arbitrarily selected 20 m/s).  The tanker(s) must leave LEO rather full of propellant,  so that it (they) may offload a significant amount to the cargo Starship on the way to the moon.  They also must provide 20 m/s rendezvous delta-vee.  How much a tanker can deliver is set by the ship propellant capacity,  and the need to make a free return and landing. 

The cargo starship then makes a direct landing on the moon,  offloads all its payload,  and then makes a direct escape from the moon onto the return trajectory for Earth,  at zero payload.  It makes a direct entry and landing on Earth.  If it were to carry return payload,  then the refueling propellant quantity from the tankers must increase.  There is a limit to what they can hold,  which will set max return payload rather low.

The tankers are presumed to be cargo/passenger Starships flown at zero payload,  just as before. All Starships are presumed to have 3 sea level Raptor engines that gimbal,  and 3 vacuum Raptor engines that are essentially fixed.  Whether nominal or abort,  all landings must be made at a feasible weight,  that being set by engine thrust and a factor 1.5 thrust to weight ratio. 

For flight safety purposes,  it must be assumed that there is one engine “out”,  so the landings must be made on the thrust of two landing engines,  not all three.  The sea level Raptor is listed as “2 MN thrust” on the Spacex website.  That sets max landing mass of any of the Starships at 271 metric tons,  which is 120 tons inert plus 151 tons of propellant-plus-payload.   If you are carrying 149 tons of payload,  you cannot have more than 2 tons of propellant remaining after landing,  and still meet that thrust/weight criterion.

I ran this scenario for the case of departing from circular LEO.  I did not investigate elliptic LEO departure,  although it would have a similar effect as before.  I ran the nominal 149 metric ton payload that is deliverable to circular LEO,  and determined a two-tanker solution.  One fly-along tanker is not feasible.  I then bounded the problem at zero payload in the cargo Starship,  to see if a one-tanker solution was feasible in that limiting case.  It was not,  therefore there are only two-tanker solutions for this refueling-along-the-way scenario.

The results I got for nominal circular-LEO payload delivery are illustrated in summary in Figure A.  The image of the spreadsheet is given in Figure B.  I don’t really see a vast improvement over refueling in LLO before the descent to the moon’s surface,  although a little less propellant need be ferried up to LEO (2700-2800 tons vs 3300-3400),  if you do it as a fly-along refueling.  You do incur the simultaneous departure requirement,  which you do not incur,  if you refuel in LLO.  Refueling in LLO after the surface excursion requires less propellant be sent to LEO,  but carries far less payload (by roughly a factor of 3).

In LLO,  one vehicle stays in circular LLO with the shorter period,  the other must go elliptical at the same perilune,  and a slightly longer period.  After a few orbits,  the two will be in the same place at the same time at perilune,  and the vehicle in elliptic orbit can circularize.  And THAT is the rendezvous technique!  This cannot work unless one of the vehicles is on a different trajectory that repeatedly converges with the trajectory of the other vehicle in a short time.  You simply cannot do that on the transfer trajectory from Earth to moon,  because you will arrive at the moon before your orbits converge again.


In the event of an abort because of non-simultaneous departures,  both the cargo Starship and the tankers will be overweight to land,  particularly the tankers.  These vehicles will have to vent some propellant to space (~15 tons for the cargo Starship,  and about 190 tons for the two tankers) before entering Earth’s atmosphere.  If they do not,  they will crash due to insufficient thrust,  required to land that weight.  And that is what the 271 metric ton landing mass requirement prevents.

 Figure A – Essential Characteristics of the Fly-Along Refueling Scenario from Circular LEO

Figure B – Spreadsheet Image of the Fly-Along Refueling Scenario Analysis from Circular LEO


Sunday, July 5, 2020

How the Spreadsheet Works


The image shown is the image of the spreadsheet I have been using recently to evaluate multi-burn performance of rocket vehicles.  The specific one illustrated is that used for analyzing the Spacex “Starship” on a direct-landing moon mission,  with direct return.  It is the same spreadsheet layout as was used to analyze that vehicle on a two-way Mars mission.  That Mars article is 6-21-2020 “2020 Starship/Superheavy Estimates for Mars”.  The lunar trajectory delta-vee (dV) data came from 7-3-2020 “Cis-Lunar Orbits and Requirements”.  The moon mission analysis is 7-5-2020 “2020 Estimates for Spacex’s “Starship” to the Moon”.

The spreadsheet has a block of weight-statement reference data above the main calculation block.  These weight statements apply to the outbound and return legs of the mission.  Only the yellow highlighted items are inputs.  That is because the inert structural mass and loadable propellant mass do not change.  The dead-head payload mass does not have to be the same during the return as it was during the outbound voyage,  so it is an input.  The pre-calculated items are highlighted tan.

Return leg items D3 (an identifier),  E3 (inert structural mass in metric tons),  and G3 (propellant max load in metric tons) are set equal to outbound leg inputs D2,  E2,  and G2,  respectively.  The ultimate outbound ignition mass in H2 is the sum of E2 and F2 and G2.  Similarly,  the ultimate return ignition mass in H3 is the sum of E3 and F3 and G3.  The ultimate “dry tanks” masses in I2 and I3 are the sums of E2 and F2,  and E3 and F3,  respectively.  All masses are metric tons.

This vehicle has a mix of two different engines,  a vacuum design and a sea level design.  The sea level design has both sea level and vacuum performance,  the vacuum design has only vacuum performance.  The performance index is specific impulse (Isp) in seconds.  Values are input for the outbound leg,  and they do not change for the return leg.  Those values are merely set equal to the outbound values.

For the main calculation block,  row 6 contains the headings.  The input kinematic dV values (km/s) are in column C,  rows 7 through 12,  highlighted yellow.  In this analysis,  each leg of the voyage has a departure burn,  a course correction burn,  and a landing burn.  The “jigger factor” factors which multiply these dV values are located in column D,  rows 7 through 12.  All of these are actually user inputs,  though not all are highlighted yellow in this image.  The mass ratio-effective dV values (km/s) are in column E,  rows 7 through 12.  E7 is D7 multiplied by C7,  E8 is D8 times C8,  etc. 

The engine selections and performance values are given in columns F,  G,  and H,  rows 7 through 12.  The names and Isp values are actually user inputs and should be highlighted yellow,  although these are not in the image. The names should match the identifiers in row 1,  items J, K,  or L,  as appropriate.  The Isp values should match row 2 / J through L as appropriate for the outbound leg,  and row 3 / J through L as appropriate for the return leg.  For this model as illustrated,  the orbit departure and course correction burns,  plus the takeoff from the moon,  are all done with the vacuum engines.  The two landings require the thrust vectoring available only with the sea level engines,  despite their being used in vacuum on the moon,  and at sea level on Earth. The exhaust velocity values (km/s) in column H,  rows 7 through 12,  are all computed from the Isp data in column G.  That computation is Vex = 9.80667*Isp/1000.  It is done by rows:  H7 = G7*9.80667/1000.,  H8 = G8*9.80667/1000.,  etc.

It is the individual-burn ignition weights in column I,  rows 7 through 12,  that allow one to tailor this model between refueled or unrefueled missions.  For the outbound leg,  it is presumed the vehicle departs fully fueled from LEO.  Thus I7 must be set equal to H2.  The velocity ratios in column J are simply the factored dV data in column E divided by the exhaust velocity data in column H.  This is done row-by-row: J7 = E7/H7,  J8 = E8/H8,  etc.  The mass ratio data in column K for each burn are the base-e exponentials of the velocity ratio data in column J,  done row-by-row:  K7 = EXP(J7),  K8 = EXP(J8),  etc.  The mass at end-of-burn data is in column L.  This is the burn ignition mass in column I,  divided by the mass ratio data in column K,  done row-by-row:  L7 = I7/K7,  L8 = I8/K8,  etc.

The “trick” is in the details of how the burn ignition mass data in column I are computed.  For the unrefueled lunar mission shown,  the ignition mass for the burn at hand is the previous end-of-burn mass,  all the way down to row 12:  I8 = L7,  I9 = L8,  etc,  with one exception.  The ignition mass for the return leg launch must reflect the return payload,  not the outbound payload.  Thus I10 is not just L9,  but is I10 = L9 -F2 + F3,  which subtracts the outbound payload F2 from that weight statement,  and then adds in the return leg payload F3 from that weight statement.   

For the Mars mission,  which is presumed to be fully refueled on Mars before its return launch,  you set the launch burn ignition mass in I10 directly to the ignition mass H3 in the return leg weight statement:  I10 = H3.  Doing the “right thing” with return launch ignition mass is exactly how one refuels-or-not,  and what payload one carries.  That is the utility of having the weight statements as a closely-adjacent reference data block.

For each burn,  the change in mass from ignition to end-of-burn is literally the mass of propellant used to make that burn.  Propellant increments used are in column M,  done row-by-row:  M7 = I7 – L7,  M8 = I8 – L8,  etc.  What one wants to book-keep is propellant-remaining,  which would be the propellant mass you started with,  minus the sum of what you have used so far.  This is the blue-highlighted data in column N.  When that number goes negative,  you have tried to use more than what you had available.  The analysis becomes infeasible,  and you can tell exactly at what point in the mission this infeasibility sets in.  The most straightforward way to adjust this outcome is to adjust that leg’s payload in the corresponding weight statement.

For the lunar mission,  which is unrefueled on the moon,  you model the Earth departure burn in row 7 by setting propellant remaining N7 to what you originally started with G2 less what you just burned M7:  N7 = G2 - M7.  After that,  you just use the previous propellant remaining value and subtract your current usage from that:  N8 = N7 - M8,  N9 = N8 – M9,  etc,  all the way down to row 12. For the Mars mission,  you launch the return leg fully fueled,  so you set propellant remaining after the first burn N10 to what you start the leg with G3,  less what you just used M10:  N10 = G3 – M10.  Otherwise,  the recursion pattern is the same.

I put a little calculation block out to the right to investigate the sensitivity of these results to the inert mass in the weight statements.  The inert mass as it is in Q6 gets set to E2.  You set a lower revised inert mass in Q7.  The difference Q6-Q7 is the change in non-propellant mass.  Payload mass as it is in Q9 gets set to the weight statement value F2.  What the payload could become is its current value plus the difference in inert masses:  Q10 = Q8 + Q9.  These numbers apply to the outbound voyage,  and only have physical meaning if that outbound voyage shows as feasible (positive propellant-remaining values in column N, specifically N7 through N9).

If you need to model more than 3 burns per leg,  insert more rows. Remember,  the modeling controls for refueling-or-not,  and what payload you carry in each leg,  are in the initial-burn selections for ignition mass,  and for propellant-remaining, for each leg.  The modeling controls for what engine performance to use are in those columns.  The rest is nothing but a straight recursion of cell updates down each column.


Update 7-6-20:  This is what the spreadsheet looks like when I clean it up,  make it run two cases in the one worksheet,  and include all the instructions and notes upon it.  It is in effect its own user’s manual,  and a template for all sorts of analyses.  What one should do is copy this to another worksheet,  then edit that copy’s inputs to represent the analysis you want to run.  Keep this one as a template.

The first case is departure from circular low Earth orbit (LEO) at 300 km altitude with “Starship”,  to a direct landing that is an out-of-propellant stranding upon the moon.  You can tell by the negative numbers for propellant remaining for the return trip burns,  with only a small fraction of a ton remaining upon landing on the moon.  One iteratively inputs payloads until that criterion is satisfied:  fractional-ton propellant remaining at whatever condition is the end-of-mission.  The payload carriable in this scenario is considerable,  but the vehicle is lost:  this is a one-way trip!  Very unattractive for a vehicle design whose two major attractive characteristics are (1) its large payload size,  and (2) its low cost because of its reusability.

The second case departs from elliptic LEO (300 x 1400 km altitudes),  and is actually able to return all the way to direct Earth entry and landing.  You can tell by the positive fractional-ton remaining propellant after the Earth landing.  This is a two-way trip,  but the return payload is restricted to zero in order to maximize payload brought to the moon.  Unfortunately,  the delta-vee demanded of the round trip is just too high,  resulting in a rather trivial payload-to-the-moon capability.  Reducing the inert mass (120 metric tons) to goal levels (100 metric tons) does not change that outcome all that materially-much:  payload is still too small to be attractive.

The message from comparing these two cases is that the delta-vee requirement demanded of the design must reduce further still.  That is the biggest difference between the two missions shown.  Either this vehicle should deliver payload into lunar orbit instead of the surface,  or else a far more elliptical LEO is needed,  to decrease the departure delta-vee further.  That last would incur an apogee well into the dangerous Van Allen radiation belts,  while in elliptic LEO.  It also reduces the payload the vehicle can carry to LEO.