Monday, January 9, 2012

Launch Cost Data

I took a look around on the internet, visiting various company and industry watchdog sites, looking for payloads deliverable to low earth orbit (LEO), and the launch costs associated with them. I found pretty good payload information. Launch costs are little more speculative, especially as some of the data was not quite current.

Update 9-25-12: I put this data on a more traceable basis in a later posting dated 5-26-12. That one supersedes this one. That same set of more traceable data I updated further, to include the projections for the new NASA giant SLS launch rocket, in a posting dated 9-13-12. That one supersedes both of these earlier ones.

I looked up some pretty reliable data for the Spacex family of Falcon rockets. Falcon 1 and Falcon-9 are already flying, and the cost data were available directly on the Spacex site. Falcon-Heavy is supposed to fly for the first time this year.

I found some pretty reliable payload data for a few members of ULA's Atlas-5 family. That's now a joint venture of Boeing and Lockheed Martin. The Atlas family was formerly operated by Lockheed Martin. The cost data came from a watchdog site, but I think it is fairly current. I have data for the -401, -551, and -HLV configurations.

I also found some payload data for a few Delta 4 configurations on the same ULA site. Delta is a Boeing operation, built in ULA facilities. I found cost data for only Delta-4 Heavy on a watchdog site, but it's about 5 years old. So, if anything, today's launch costs for Delta-4 Heavy would be higher still.

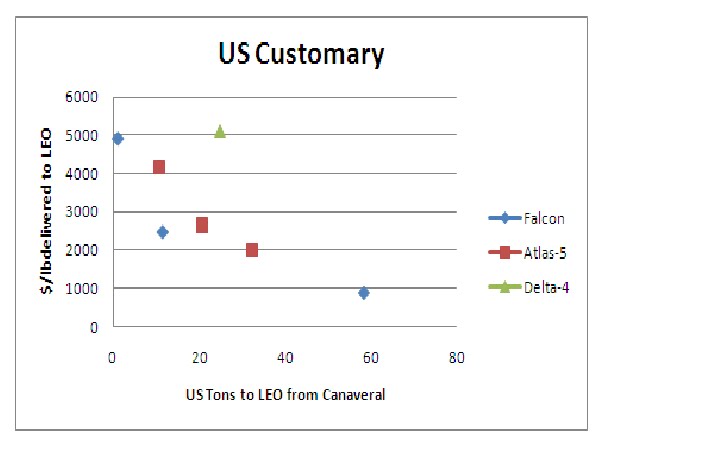
I processed these data as payload mass delivered from Canaveral to LEO, and as US dollars per unit mass of payload (payload mass divided by launch cost). The results are plotted here in metric units ($/kg vs metric tons) and in US customary units ($/lb vs US tons). I expected to see the "scale effect" operating (lower cost per mass at higher masses), and I did.

But, there are differences among the vendors. Remember, when assembling something large in LEO, it is the cost per unit mass that determines your overall project launch costs. Once the Spacex Falcon-Heavy is flying, it will be very hard to beat, in terms of unit cost and absolute payload tonnage. Judge for yourself ----

In metric:


In US customary:

Monday, January 2, 2012

On Somali Pirates: "I Told You So"

From an article by Neal Ungerleider, on MSNBC.msn.com, 2 January 2012

“Commercial shipping is one of the most cutthroat industries in the world, and shipowners don't have the budgets to spend on space-age defenses. The recent drop-off in piracy has been due to the increased use of armed guards, not technological innovation, which in turn have been made economically feasible by skyrocketing ransoms and lengthening captivity periods. One insurance company issued a stat a few months back that 80 percent of pirate attacks were being repelled by armed guards, and no vessel employing them has been hijacked.”

http://technolog.msnbc.msn.com/_news/2012/01/01/9834437-fighting-somali-pirates-with-science

Now for the “I told you so” part:

This was the first, best recommendation that I made, of three, nearly 3 years ago on 4-11-09, on this site, in an article titled “3 Solutions to the Somali Pirate Problem”.

Friday, December 30, 2011

The Old Train Still Runs!

For the first time in a few years, I set up my old electric train in the shop. I got this train as a very young boy, Christmas of 1952. My dad and his next door neighbor built the train board layout in 1954. Some of the items, including two more freight cars, were added between then and about 1960.

The engine and tender is a 4-6-4 coal-fired steam locomotive of the type that was used to pull passenger trains on the old New York Central railway. Lionel called this particular engine 2046, and used it in more than one of their train sets. My original set included a silver tank car, silver box car, black gondola car, and a caboose. The yellow barrel car and the red explosives box car got added later.

The first image shows a good close-up of the engine and tender:


The second image shows the whole train board layout. The inner (third) loop of track is something I added about a decade or so ago. The original setup had two concentric loops connected by 4 switches, all 1954-ish vintage track and switches.

Along the way, the two extra freight cars, the crossing equipment, the water tower, and the beacon got added, as Christmas presents, if I remember correctly. My paternal grandmother gave me the gantry crane, which still works. It rotates, moves up and down, and the electromagnet still picks up iron things.

I put some miscellaneous small toy cars into this set-up. I also built the loading ramps out of scrap wood from an old VW bus wooden headliner. My painted-paper landscape simulation from over 20 years ago has deteriorated past repair. I need to replace it, and add some more hand-made buildings. I'll do it, once I retire.


The third image is my finger pointing at the entry in an original 1953 Lionel catalog for the exact set that is my original train: 1505WS, which was $49.95 in 1952-dollars, and still the same price in 1953. My good friend Harry Petersen in Minnesota found that catalog and sent it to me. He, too, is a model railroad enthusiast.


Below I have embedded a video clip taken with my wife's camera of this train running on that train board. It no longer smokes, but the whistle still blows. This thing is 59 years old this year, and it still runs! In spite of all the mistreatment I gave it as a child. Lionel certainly made a good product.

This posting is just for fun. Hope you enjoyed looking at it.

GW

Wednesday, December 28, 2011

Latest Production Version of the Kactus Kicker

Update 7-30-15:  The new website is fully operational.  It has all the information,  photos,  and videos anyone could ever need.  It is a turnkey site for selecting,  customizing,  and purchasing a production tool.  Shipping is available,  so sales of plans have been discontinued.  Some additional parts and labor have been farmed out to appropriate vendors,  to adjust to higher production rates,  so prices posted previously are now obsolete.  Go to http://www.killyourcactusnow.com

Update 3-1-18:  the killyourcactusnow site has been shut down in favor of a new and improved site http://howtokillcactus.com,  with even better information,  photos,  and videos.  

For those of you wanting to know about my cactus tools, here are some pictures of the latest production model with the tougher snout and bigger barge front. These are from my wife's computer, file number 2010-04-25. I believe they were taken after construction of serial numbers 047 and 048.

This is a "machine" with no moving parts, towed on a simple chain bridle behind any tractor with a drawbar. It kills prickly pear cactus "in situ", without pick-up and disposal of the debris, and without chemicals. It's just driving-a-tractor work. You do it several times, for a full eradication. See http://www.txideafarm.com and go to the cactus eradication sub-page for a good description of how it really works.


photo 040 How to Hitch-Up

It really is just that simple. Flip the loop in the tow bridle over a trailer ball on your towbar. If you do this with a 3-point rig, be sure it is braced for sideways loads over 1000 pounds per tool (you can tow more than one at a time). You will incur forces like that when you turn.


photo 041 What the Bridle Looks Like All Hitched-Up and Ready to Tow

Be sure the bridle is not in the lift configuration, pinned up with a bolt over the tool's center of gravity. It needs to make a big Vee, you tow from the corners of the deck. The snout just stabilizes it like a gigantic, super-tough sled runner out front. The chain through the snout braces just limits up/down and side-side travel on really rough ground. It should be slack, otherwise.


photo 042 How-To Pry-Up the Tool to Get at What's Underneath, or Store It

Back up the tractor and slack the chain, then un-hitch it. You will need about a 6-foot prybar and a 2-foot piece of small angle iron. Use the prybar as the photo shows to get leverage to lift the tool up onto its rear edge, then prop it in place with the angle iron under one of the skids. The "tongue load" on the snout is just too high to do this without a good prybar.


photo 045 Proper Stowage Without Killing Grass

Once propped up, you can remove any debris accumulated under the tool that makes it ride off the ground. Old barbed wire and certain kinds of vine-like weeds are prone to do this. Just kick or hoe them out from underneath, and you can lower the tool with the prybar, re-hitch, and resume work. This is also a very good way to store the tool in the pasture between treatments, since it cannot kill a whole big patch of grass while tipped up on edge like this. This is how I store mine.


photo 037 How to Pick-Up the Tool with Its Own Bridle

If you pull the tow bridle aft, you can pin it together with the extra 2"L 3/8 UNC bolt, nuts, and washers that I provide with every tool. If you have serial number 047 or 048, you might have to re-rig the snout travel-limiter chain slightly to do this, but I generally already have it rigged for lifting easily, right from the shop (from serial number 049-on). The center of gravity is just between the rear of the snout tube and the front edge of the big ballast bar flat. Pin the bridle together there, and pick it up at the pin point as shown.

The snout travel-limiter picks up the forward load of 3-places, the chain towers being the other two. Be careful, this thing weighs 600-700 pounds. But most tractors now have hydraulic buckets. Just use a tow chain with hooks, and pick the tool up with the bucket, and put it right where you want it (pick-up bed or flat trailer).

GW

Other Related Articles on this Site (date highlighted on this one)


Date.....…title/content
2-9-17....Time Lapse Proof It Works
............watch cactus being crushed and composted
7-30-15......New Cactus Tool Website
...................turnkey site for info,  photos,  videos,  purchases
1-8-15……Kactus Kicker Development
………………production prototype & 1st production article
1-8-14……Kactus Kicker: Recent Progress
…………..….testing a revised wheeled design (experimental)
10-12-13..Construction of the Tool
………………building a “Kactus Kicker” (plain tool)
5-19-13…….Loading Steel Safely
……………….transport and storage of materials
12-19-12…Using the Cactus Tool or Tools
……………...how the tool is employed (applies to any model)
11-1-12….About the Kactus Kicker
..…………….painting and rigging finished tools (plain tool)
12-28-11..Latest Production Version
………………new bigger snout and barge front (plain tool)

Wednesday, December 21, 2011

FTL Neutrinos Update

I posted an update to the faster-than-light neutrinos article. Scroll down to it dated 10-9-11 and titled “Faster-Than-Light Neutrinos? Maybe! Their Meaning? Arguable!”

GW

Wednesday, December 14, 2011

Reusability in Launch Rockets

Update 4-8-2024:  Should any readers want to learn how to do what I do (estimating performance of launch rockets or other space vehicles),   be aware that I have created a series of short courses in how to go about these analyses,  complete with effective tools for actually carrying it out.  These course materials are available for free from a drop box that can be accessed from the Mars Society’s “New Mars” forums,  located at http://newmars.com/forums/,  in the “Acheron labs” section,  “interplanetary transportation” topic,  and conversation thread titled “orbital mechanics class traditional”.  You may have scroll down past all the “sticky notes”. 

The first posting in that thread has a list of the classes available,  and these go far beyond just the two-body elementary orbital mechanics of ellipses.  There are the empirical corrections for losses to be covered,  approaches to use for estimating entry descent and landing on bodies with atmospheres,  and spreadsheet-based tools for estimating the performance of rocket engines and rocket vehicles.  The same thread has links to all the materials in the drop box. 

The New Mars forums would also welcome your participation.  Send an email to newmarsmember@gmail.com to find out how to join up.

A lot of the same information from those short courses is available scattered among the postings here.  There is a sort of “technical catalog” article that I try to main current.  It is titled “Lists of Some Articles by Topic Area”,  posted 21 October 2021.  There are categories for ramjet and closely-related,  aerothermodynamics and heat transfer,  rocket ballistics and rocket vehicle performance articles (of specific interest here),  asteroid defense articles,  space suits and atmospheres articles,  radiation hazard articles,  pulsejet articles,  articles about ethanol and ethanol blends in vehicles,  automotive care articles,  articles related to cactus eradication,  and articles related to towed decoys.  All of these are things that I really did. 

To access quickly any article on this site,  use the blog archive tool on the left.  All you need is the posting date and the title.  Click on the year,  then click on the month,  then click on the title if need be (such as if multiple articles were posted that month).  Visit the catalog article and just jot down those you want to go see.

Within any article,  you can see the figures enlarged,  by the expedient of just clicking on a figure.  You can scroll through all the figures at greatest resolution in an article that way,  although the figure numbers and titles are lacking.  There is an “X-out” top right that takes you right back to the article itself. 

----------     

Update 3-27-18:  This article has once again become popular among readers.  One should bear in mind that these data are not for the latest version of the Falcon-9 launch vehicle.  Spacex has since proven quite convincingly that first stage reuse-ability is obtainable from a two-stage vehicle.  As of this update,  this article has been posted for over 6 years now.  Falcon-Heavy has recently made its maiden flight,  successfully recovering 2 of the 3 first stage core items.  I updated the conclusions at the end of the article to indicate what has been rendered obsolete. 

Update 7-4-17:  Events have since made this assessment of mine obsolete.  Spacex is becoming ever more successful at recovering first stage boosters,  and has even begun re-flying them.  It would seem that end-on attitude control during entry is enough to prevent wind-pressure breakup.  And,  there seems to be some sort of limiting effect on hypersonic heating,  produced by the retropropulsive rocket plume during what Spacex calls its "entry burn".  I am unsure exactly how that works.  

Be that as it may,  Spacex is enjoying considerable success recovering used first stage boosters.  There are persistent claims they want to attempt recovering second stages as well.  The difference in difficulty is considerable:  first stage entry speeds should be crudely similar to first stage speed at staging,  which is around 10,000 feet/sec (~3 km/sec).  A second stage would hit the atmosphere at essentially orbital speed:  25,000 feet/sec (~8 km/sec).  That's over 6 times higher forces and energies to deal with. 

Spacex is doing a wonderful job upending the conventional wisdom of space launch.  Blue Origin is less publicized,  but is also recovering and re-flying boosters from its suborbital vehicle.  The future would seem to hold some amazing things yet to come.  
--------------------
A group of folks I correspond with (at the forums on NewMars.com) has been discussing reusable launch rocket possibilities. One of the names they use is “big dumb booster”, or BDB. My own opinion is that reusability is incompatible with the low inert mass fractions used in the stages of typical launch rockets today: too light is simply too fragile. I do know from their website that Spacex is interested in reusing the first stage of their Falcon-9 booster, but that their results so far are unsuccessful. So, my analysis results here should be of interest, both to my correspondees, and to Spacex.

Spacex’s Falcon-9 is a two-stage rocket with kerosene-oxygen engines in both stages. It features an interstage ring and a payload shroud (on the satellite version) that I assume both get jettisoned at staging. The same engines are used in both stages, except that the one in the second stage has a longer bell than the nine in the first stage, and the first stage engines see atmospheric backpressure.

Baseline Falcon-9 Performance Estimate

I looked up most of the basic engine and vehicle data from Spacex’s website, for Falcon-9 as a baseline case, and reverse-engineered the rest. Here it is, summarized, in Figure 1:


Figure 1 – Baseline Falcon-9 Data

These performance data were computed with the simple rocket equation, and some experiential “jigger factors” that knock down ideal velocity increments to more realistic values. The other choice for analysis is a real trajectory computer code, either two-dimensional or three-dimensional, which is a complicated thing to set up and to use. I used the simple analysis approach to set up actual computer trajectory analyses, for the Scout launch vehicle at LTV Aerospace, about 4 decades ago.

Here, I used a “jigger factor” of 1.10 to knock down the first stage ideal velocity increment, because that stage sees air drag, and flies mostly vertically, so that gravity drag is significant. For the second stage, I used 1.05, reflecting flight in vacuum, mostly but not entirely horizontal. The final summed velocity increment I estimate for Falcon-9 is about 26,900 feet/second, or 8.19 km/second, which is remarkably close to the orbital velocity at low altitudes (about 7.9 km/second). It’s close enough that any simplified design trades made under these assumptions are realistic enough to be useful.

I looked at two potential solutions to the trade-off between extra structural weight for reusability, and reduced payload fraction that increases the price per unit payload delivered to orbit. One was to retain the basic two-stage design, and increase the size of the first stage to compensate for added inert fraction, at constant mass ratio. The other approach was to replace the two-stage design with an equivalent three stage design, keep the top two stages as throwaways, and increase the first stage size to compensate for increased first stage inert weight fractions. Both were done at constant delivered payload weight.

Two Stage Analysis with Heavier Structural Inert Fractions in the 1st Stage
The payload is exactly the same as baseline. I assumed the payload shroud weight to be proportional to the maximum payload weight it contains at 15.18%. There are no changes to the second stage weight statement or performance values. The interstate ring weight I assumed proportional at 0.815% to the weight it carries, in this case the second stage ignition weight. It is the first stage weight statement that varies, but at constant mass ratio, so the propellant weight fraction is the same as baseline in all cases. The equation relating mass ratio MR and propellant weight fraction fprop is:

fprop = (MR – 1)/MR

Now, 1 – fprop is the total of the inert mass fraction and the stage payload mass fraction, where the first stage payload comprises the ready-to-ignite second stage, the interstage ring, and the payload shroud. I looked at the baseline, twice, and three times the first stage inert weight fraction, scaling up the first stage ignition weight to match. The resulting weight statements are given in Figure 2. Bear in mind that the delivered stage performance data are identical to baseline, since the mass fractions are identical to baseline.

Three Stage Analysis with Heavier Structural Inert Fractions in the 1st Stage (Only)

I had to allocate velocity increments among the three stages in some logical fashion. I chose to make the second and third stage mass ratios 5 like the Falcon-9 second stage, and my first stage mass ratio 4, like the Falcon-9 first stage. I used “jigger factors” of 1.10 and 1.05 on my first and third stages, similar to the Falcon-9 first and second stages. I used an intermediate factor of 1.07 for my second stage. My first stage Isp was 289.5 sec, like the Falcon-9 first stage. My second and third stages used Isp = 304 sec, like the Falcon-9 second stage. The corresponding exhaust velocities are 9314.4 and 9780.9 ft/sec.

I computed the sum of the estimated actual velocity increments to be factor 1.5406 too high, so I knocked down each stage’s velocity increment by this factor, and recomputed mass ratios as 2.45935 for my first stage, and 2.84251 in my second and third stages. I ran the design study to the same payload as Falcon-9, with the same shroud weight, and two interstage rings at 0.815% of the stage weights above each ring. I assumed that interstage ring 1-2 and the payload shroud drop off with stage 1, and that interstage ring 2-3 drops off with stage 2.

The payload is exactly the same as baseline at 23,050 lb. I assumed the payload shroud weight to be proportional to the maximum payload weight it contains at 15.18%, for 3500 lb. There are no changes to the second or third stage weight statements or performance values as I changed first stages. The interstate ring 2-3 weight I assumed proportional at 0.815% to the weight it carries (in this case the second stage ignition weight) for 606 lb. Interstage ring 1-2 is 0.815% of stage 2 ignition weight, for 1999 lb. It is the first stage weight statement that varies, but at constant mass ratio, so the propellant weight fraction is the same as baseline in all cases, and so is the performance.

For the “baseline” three-stage inert fractions, I assumed 5% for my first stage, very similar to the multi-engine first stage of Falcon-9. I used the same 4.2% for my third stage as for the single-engine second stage of Falcon-9. My second stage has an intermediate inert fraction of 4.6%, chosen to reflect only a few engines in the second stage. The weight statements for the trade study are given in Figure 3. Bear in mind that all three versions of the three-stage vehicle have exactly the same estimated velocity performance, also shown in the figure.


Figure 2 – Weight Statements for the Two-Stage Reusability Trade Study


Figure 3 – Weight Statements for the Three-Stage Reusability Trade Study

Note that in both Figure 2 and Figure 3, I have included the overall payload weight fraction, computed as payload weight delivered to orbit Wpay, divided by the stage 1 ignition weight, which is the launch weight WL. (In the context of this analysis, the term “weight” really refers to mass.) In both trade studies, payload fraction decreases as stage 1 inert weight increases, exactly as expected. I was surprised and pleased to see that the baseline throwaway 3-stage option had a slightly higher payload fraction than the corresponding baseline throwaway 2-stage option. This and the slopes of the trends did seriously impact the final conclusions.

Trajectory Comparison

The final trajectories are compared in Figure 4. Both the 2-stage and 3-stage vehicles follow similar paths to the same orbital insertion conditions, at the same altitude (in the vicinity of 200-300 miles, or 300-500 km, up). Only potential re-use of the first stage was considered, for either configuration. A first stage fallback is indicated for each. Reentry velocity is simply assumed the same as the first stage burnout velocity. They would be comparable, in any event. Noting that reentry gets really challenging much above 10,000 feet/second (near Mach 10), I see little point to trying to make the second stage of the 3-stage vehicle reusable. It simply comes back too fast to be readily survivable.


Figure 4 – Comparison of Trajectories for 2-Stage and 3-Stage Vehicles


Figure 5 – Comparison of 2-Stage and 3-Stage Results


Payload Fraction Results Comparison

The payload fraction vs first stage inert fraction data are plotted in Figure 5 for both the 2-stage and 3-stage vehicles. The trends are reasonably linear-looking over the ranges computed, but at different slopes. As expected, the 3-stage vehicle design is less sensitive to first stage inert fraction than the 2-stage design (3-stage having the shallower slope). I did not really expect to see the baseline 3-stage vehicle to have a slightly-higher payload fraction at the baseline throwaway inert value, but it did.

Between the higher baseline throwaway payload fraction, and the shallower slope with first stage inerts, it appears that at 10% inerts in the first stage, the 3 stage vehicle has a payload fraction near 2.8%, while the 2-stage vehicle is down near 2.2% at the same 10% inerts. 10% inerts in the first stage is of enormous interest, because that is close to the inert fraction of the Space Shuttle solid booster motors, which actually were reusable most (but not all) of the time. That’s about the level where your tankage becomes strong enough to be pressure vessel-capable, as well as survivable for ocean impact on parachutes. Tankage that is pressure vessel-capable might as well be used as a pressure-feed system, eliminating the weight, cost, and reliability risks of turbopump machinery.

Conclusions (Update 3-27-18: items rendered obsolete as marked by Spacex Falcon-9 experience)

It is clear the 3-stage option is more tolerant of higher inert weights in the first stage. Combine this with a lower first stage fall-back speed, and reusability seems more certain at 10% inerts, and with a higher payload fraction (nearly 3% 3-stage vs only a bit over 2% 2-stage).  still true,  but obsolete

Accordingly, 3 stages is a better option than 2 stages, if the first stage is to be reused. The drop from 2-stage non-reusable payload fraction is actually quite small (3.1% to about 2.8%). This is because the all-throwaway 3-stage vehicle actually has a better baseline throwaway payload fraction than the 2-stage (3.3% at 5% inerts, vs 3.1% at 4% inerts).  obsolete

This does raise the question of whether 4 stages might allow first stage reusability at even better payload fraction, or else allow the same payload fraction with both first and second-stage reusability. I leave that for others to investigate.  obsolete

The main lesson here is that you really do have to do something different in order to get a different result. Reusability will require a greater inert weight fraction to cover recovery gear, and to confer the strength to survive better. Practical reusability simply cannot happen in the 4-8% inert range.  definitely obsolete

This study points toward 10% inerts in the first stage, at the very least. The more first stage inerts you have to “cover”, the more stages you need to use, to be tolerant of lowered mass ratio in each stage.  definitely obsolete

But at least we know the job really can be done, and here is one well-proven way to do it (more stages).   Update 3-27-18:  still true,  but rendered obsolete with Spacex's successful experience recovering first stages at 5% inerts in a two-stage vehicle.

Sunday, November 13, 2011

Gas Fracking: Good or Bad? Depends!

Recent news reports published by the internet news services tell how the EPA is seriously investigating complaints related to natural gas fracking (hydro-fracturing) near Pavillion, Wyoming. Those complaints include contamination of water supplies by methane and by toxic fracking chemicals.

I looked up the geography and geology of Pavillion: it lies in the western half of Wyoming, a region dominated by the Rocky Mountains. There will be sediments in the basins, but the fundamental underlying geology is contorted and fractured mountain zone rock.

As a result, I am entirely unsurprised that both natural gas and fracking chemicals are finding their ways into the groundwater. I am surprised that how this can be, is a still a matter of legal debate.

I am no geologist, but even I can understand what is happening, and how, and I published it as a guest column in the Waco Tribune Herald last May. Here is the original submitted text for that column, with some emphasis added now:

Coming Even Cleaner on Fracking” (submitted 5-26-11/published 5-28-11)

The “Trib’s” editors recently ran a very nice editorial on the controversy surround the process of “fracking” (short for “hydraulic fracturing”) for natural gas in shale. This article neatly laid out the two sides of the public debate, which is centering mainly on whether or not there are undesirable side effects.

I find it very interesting that the studies are "still inconclusive", seeing as how the field data is very indicative of what actually happens. It's not a simple either-or situation, it’s geology-dependent, and this is completely left out of the current public debates.

Here in Texas and nearby states, the rock layers are old seabed sediments, more or less level, and are relatively intact. Few paths exist across these layers for oil and gas to migrate upward. That is why fracking has few side effects in this part of the country. The most notable exception has been very minor earthquake tremors induced from the disposal of used fracking fluids by deep well injection.

In Pennsylvania and the other states in the Appalachian mountain zone, there have been widespread complaints about natural gas getting into groundwater, leading to fire and explosion incidents when turning on the water tap. These are real incidents, and are easy to understand if one simply looks at the geology below the surface.

In a mountain zone, the rock layers are highly contorted, fractured, and thoroughly broken-up. There are many paths for oil, and especially the far-more-mobile gas, to migrate to the surface. It is entirely unsurprising, and in fact quite predictable, that this very mobile gas, once released from a deep shale, should migrate upward and contaminate near-surface water supplies. It does so by dissolving into the water under earth pressures, similar to a carbonated beverage.

The solution to the exploding kitchen faucet problem is simple: fracking for gas is OK in continuous-layered sea bottom sediment zones, but not OK in highly-fractured mountainous zones. So, we don't frack there, period. Those gas deposits await a still-undiscovered recovery technology with fewer side effects, more suited to that kind of geology.

This does mean that the agencies regulating gas leases actually do have to regulate, and sometimes to deny permits, unaccustomed as they apparently are to such activities.

The processes of fracking and fracking-fluid disposal were specifically exempted from EPA regulation under the Clean Water Act. This happened in that secretive energy company meeting at the White House during the last administration. It is known as the Halliburton exemption.

However, the injection of diesel fuel into the earth is actually still regulated. While fracking fluid is mostly water plus a little sand or glass beads, the most common liquid trace additive in all these "secret" recipes is diesel fuel. If those recipes were widely revealed, the use and disposal of these fluids would come under direct EPA regulation again, meaning only that they take a little better care doing what they already do.

In that event, fracking for gas would still be quite profitable, just not quite as much as it is without any regulation at all. But fewer folks suffer the side effects, and that’s a good thing.

Update 1-3-15:

The recent explosion of US “fracking” technology (hydraulic fracturing plus horizontal-turn drilling) has modified the picture of oil prices versus recessions.  Unexpectedly,  the US has become a leading producer of crude oils for the world market.  Plus,  there has been an associated massive production increase and price drop in natural gas.

OPEC has chosen to take the income “hit” and not cut back their production in response.  Their reasoning is twofold:  (1) fear of loss of market share,  and (2) hope that low oil prices will curtail US “fracking” recoveries.  We will see how that plays-out.

Oil prices are now such (at around $55/barrel) that US regular gasoline prices are nearing $2.00/gal for the first time in a very long time.  This is very close to the price one would expect for a truly competitive commodity,  based on 1958 gasoline prices in the US,  and the inflation factor since then. 

It is no coincidence that the exceedingly-weak US “Great Recession” recovery has suddenly picked up steam.  The timing of the acceleration in our economic recovery versus the precipitous drop in oil prices is quite damning.  There can be no doubt that higher-than-competitive-commodity oil prices damage economies.  Oil prices are a superposition of the competitive commodity price,  overlain by an erratic increase from speculation,  and further overlain quite often by punitive price levels when OPEC is politically unhappy with the west.  That’s been the history. 

This economic improvement we are experiencing will persist as long as oil,  gas,  and fuel prices remain low.  (Government policies have almost nothing to do with this,  from either party.)  How long that improvement continues depends in part upon US “fracking” and in part upon OPEC.  Continued US “fracking” in the short term may depend upon adequate prices.  In the long term,  we need some solutions to some rather intractable problems to continue our big-time “fracking” activities. 

The long-term problems with “fracking” have to do with (1) contamination of groundwater with combustible natural gas,  (2) induced earthquake activity,  (3) lack of suitable freshwater supply to support the demand for “fracking”,  and (4) safety problems with the transport of the volatile crude that “fracking” inherently produces. 

Groundwater Contamination

Groundwater contamination is geology-dependent.  In Texas,  the rock layers lie relatively flat,  and are relatively undistorted and unfractured.  This is because the rocks are largely old sea bottom that was never subjected to mountain-building.  We Texans haven’t seen any significant contamination of ground water by methane freed from shale.  The exceptions trace to improperly-built wells whose casings leak.

This isn’t true in the shales being tapped in the Appalachians,  or in the shales being tapped in the eastern Rockies.  There the freed gas has multiple paths to reach the surface besides the well,  no matter how well-built it might have been.  Those paths are the vast multitudes of fractures in the highly-contorted rocks that subject to mountain-building in eons past.  That mountain-building may have ceased long ago,  but those cracks last forever. 

This is why there are persistent reports of kitchen water taps bursting into flames or exploding,  from those very same regions of the country.   It’s very unwise to “frack” for gas in that kind of geology.

Induced Earthquake Activity

This does not seem to trace to the original “fracking” activity.  Instead it traces rather reliably to massive injections of “fracking” wastewater down disposal wells.  Wherever the injection quantities are large in a given well,  the frequent earthquakes cluster in that same region.  Most are pretty weak,  under Richter magnitude 3,  some have approached magnitude 4. 

There is nothing in our experience to suggest that magnitude 4 is the maximum we will see.  No one can rule out large quakes.   The risk is with us as long as there are massive amounts of “fracking” wastewater to dispose of,  in these wells.  As long as we never re-use “frack” water,  we will have this massive disposal problem,  and it will induce earthquakes. 

Lack of Freshwater Supply to Support “Fracking”

It takes immense amounts of fresh water to “frack” a single well.  None of this is ever re-used,  nor it is technologically-possible to decontaminate water used in that way.  The additives vary from company to company,  but all use either sand or glass beads,  and usually a little diesel fuel.  Used “frack” water comes back at near 10 times the salinity of sea water,  and is contaminated by heavy metals,  and by radioactive minerals,  in addition to the additives.  Only the sand or glass beads get left behind:  they hold the newly-fractured cracks in the rocks open,  so that natural gas and volatile crudes can percolate out. 

The problem is lack of enough freshwater supplies.  In most areas of interest,  there is not enough fresh water available to support both people and “fracking”,  especially with the drought in recent years.  This assessment completely excludes the demand increases due to population growth.  That’s even worse.

This problem will persist as long as fresh water is used for “fracking”,  and will be much,  much worse as long as “frack” water is not reused.  The solution is to start with sea water,  not fresh water,  and then to re-use it.  This will require some R&D to develop a new additive package that works in salty water to carry sand or glass beads,  even in brines 10 times more salty than sea water. 

Nobody wants to pay for that R&D. 

Transport Safety with Volatile “Frack” Crudes

What “fracking” frees best from shales is natural gas,  which is inherently very mobile.  Some shales (by no means all of them) contain condensed-phase hydrocarbons volatile enough to percolate out after hydraulic fracturing,  albeit more slowly than natural gas.  Typically,  these resemble a light,  runny winter diesel fuel,  or even a kerosene,  in physical properties.  More commonly,  shale contains very immobile condensed hydrocarbons resembling tar.  These cannot be recovered by “fracking” at all. 

The shales in south Texas,  and some of the shales and adjacent dolomites in the Wyoming region actually do yield light,  volatile crudes.  The problem is what to transport them in.  There are not enough pipelines to do that job.  Pipelines are safer than rail transport,  all the spills and fires notwithstanding. 

The problem is that we are transporting these relatively-volatile materials in rail tank cars intended for normal (heavy) crude oils,  specifically DOT 111 tank cars.  Normal crudes are relatively-nonvolatile and rather hard to ignite in accidents.  DOT 111 cars puncture or leak frequently in derail accidents,  but this isn’t that serious a problem as long as the contents are non-volatile.  These shale-“frack” light crude materials resemble nothing so much as No. 1 winter diesel,  which is illegal to ship in DOT 111 cars,  precisely since it is too volatile. 

The problem is that no one wants to pay for expanding the fleet of tougher-rated tank cars.  So,  many outfits routinely mis-classify “frack” light crudes as non-volatile crudes,  in order to “legally” use the abundant but inadequate DOT-111 cars.  We’ve already seen the result of this kind of bottom line-only thinking,  in a series of rather serious rail fire-and-explosion disasters,  the most deadly (so far) in Lac Megantic,  Quebec. 

Volatile shale-“fracked” crudes simply should not be shipped in vulnerable DOT 111 cars,  period.  It is demonstrably too dangerous. 

Conclusions

“Fracking” shales for natural gas and light crudes has had a very beneficial effect on the US economy and its export-import picture.  We should continue this activity as a reliable bridge to things in the near future that are even better. 


But,  we must address the four problem areas I just outlined.  And I also just told you what the solutions are.  The problem is,  as always,  who pays.   What is the value of a human life?  What is the value of a livable environment?  It’s not an either-or decision,  it’s striking the appropriate balance!