A previous study (reference 1) indicated that a manned Mars lander might be in the 60 metric ton “mass class”, and might have a ballistic coefficient in the neighborhood of 1200 kg/sq.m. Such a craft would be roughly conical at something around 7 m diameter. There is considerable uncertainty associated with that ballistic coefficient value, perhaps the plus-or-minus 500 kg/sq.m used here.
Another previous study (reference 2) used a 200 Km circular orbit about Mars as the point of departure for deorbit and entry. That path was arbitrarily selected to have a periapsis of surface impact. Orbit calculations using the recommended interface altitude of 135 Km (see reference 3), gave nominal entry conditions of 3.469 Km/s at 1.63 degrees down entry angle relative to local horizontal. These would apply to any ballistic coefficient. That de-orbit trajectory is depicted in Figure 1. The nominal de-orbit delta-vee is 50 m/s.

Figure 1 – Nominal De-Orbit Burn Trajectory
The reference 2 study found that end-of-hypersonics (at local Mach 3) occurred at relatively low altitudes compared to our previous experience with the much smaller unmanned probe landers, and that the higher the ballistic coefficient, the lower the end-of-hypersonics altitude. That effect was re-explored here, with a tighter spread of ballistic coefficients more applicable to actual vehicle rough-sizing. Providing that kind of sensitivity analysis to support lander rough-sizing is the purpose here.
It has been suggested that a way to alleviate the low altitude problem is to reduce velocity at entry interface by applying a larger rocket de-orbit burn. That effect was explored here at the nominal ballistic coefficient of 1200 kg/sq.m, with a 10-times-larger de-orbit delta vee of 500 m/s. As shown in Figure 2, orbit calculations gave the expected lower entry interface velocity, but at a considerably steeper entry angle:
Vatm = 3.029 Km/s
γ = 6.4 degrees

Figure 2 – “Big De-Orbit Burn” Trajectory
The entry model is the same 1956-vintage 2-D Cartesian “back-of-the-envelope” model described in reference 3 along with the atmosphere model. I updated this and reported those results in reference 4. Data groups are reported for the nominal 1200 kg/sq.m case, for “plus 500” (1700 kg/sq/m), and for “minus 500” (700 kg/sq.m), all on the nominal de-orbit trajectory. A plot of the salient results is given in Figure 3.

Figure 3 – Sensitivity Results
A data group is also reported for the “bigger de-orbit burn” trajectory, at the nominal 1200 kg/sq/m ballistic coefficient. That case was not included in the results plot, precisely because the steeper entry angle overcame the benefit of slower entry speed by so much, that surface impact occurred before the hypersonics were over. Surface impact occurred at a speed in the neighborhood of Mach 4.7, in this “typical” Mars atmosphere.
Reported Data and Methods
All data groups comprise spreadsheet images, a plot of velocity vs slant range, a plot of range and slant range vs altitude, a plot of deceleration gees vs slant range, and a plot of convective heating data vs slant range. These figures are all given at the end of this article.
For the heating data, the nose radius in the correlation was increased to a more realistic 50 m for a very large lander on the order of 7 m diameter. Tripling the heating data would probably “cover” the missing radiative heating effects, in the absence of better data.
The density scale height model was unchanged from that given in reference 3 (about 8.4 Km). This is not strictly accurate, but really doesn’t matter that much to calculated outcomes. This is because the scale height is just as non-constant from 0 to 25 Km altitudes, as it was for the 25-70 Km altitudes in reference 3. An average value for the lower altitude range (nearer 9.5 Km) is a bit different from that for the higher altitude range, but not by very much. The model is just about as “wrong” away from either average value. See Figure 4.

Figure 4 – Mars Density Scale Height Profile
Conclusions
1.It is critical that angle-below-horizontal be held to very low values in the neighborhood of 1.6 degrees, or less. One way to do this is to lower the circular orbit altitude. Another is the raise the periapsis of the entry trajectory above the surface (but not by too much).
2.For actual orbit conditions, a bigger deorbit burn reduces entry interface velocity, but steepens entry angle-below-horizontal. The angle effect is stronger, leading to surface impact before the craft can slow to Mach 3.
3.Vehicles in this class will likely come out of hypersonics at around 8 Km altitude, give or take a couple of Km, with only secondfs to go before surface impact, if not retarded at considerable gee.
4.These results are good enough to get “in the ballpark” for vehicle rough-out, but most definitely not good enough to support detail design.
References
1.G.W. Johnson, “Rough Correlation of Entry Ballistic Coefficient vs. Size for “Typical” Mars Landers”, article dated 7-25-12, posted to http://exrocketman.blogsapot.com.
2.G. W. Johnson, “Ballistic Entry From Low Mars Orbit”, article dated 8-5-12, posted to http://exrockretman.blogspot.com
3.“Atmospheric Environments for Entry, Descent, and Landing (EDL)”, C. G. Justus (NASA Marshall) and R. D. Braun (Georgia Tech), June, 2007.
4.G. W. Johnson, “Back of the Envelope Entry Model”, article dated 7-14-12, posted to http://exrocketman.blogspot.com.
Detailed Data
Detailed inputs and how they are used are given in Figure 5. The nominal case of 1200 kg/sq.m on the nominal de-orbit trajectory is described by Figures 6-10. The “plus 500” (1700 kg/sq.m) case on the nominal de-orbit trajectory is described by Figures 11-15. The “minus 500” (700 kg/sq.m) case on the nominal de-orbit trajectory is described by Figures 16-20. The “big de-orbit burn” case of the nominal 1200 kg/sq.m on the steeper trajectory is described by Figures 21-25.

Figure 5 – Detailed Inputs and Their Uses

Figure 6 – Spreadsheet Image for the Nominal Case (1200 kg/sq.m, 1.63 degrees)

Figure 7 – Nominal Case Velocity vs Slant Range
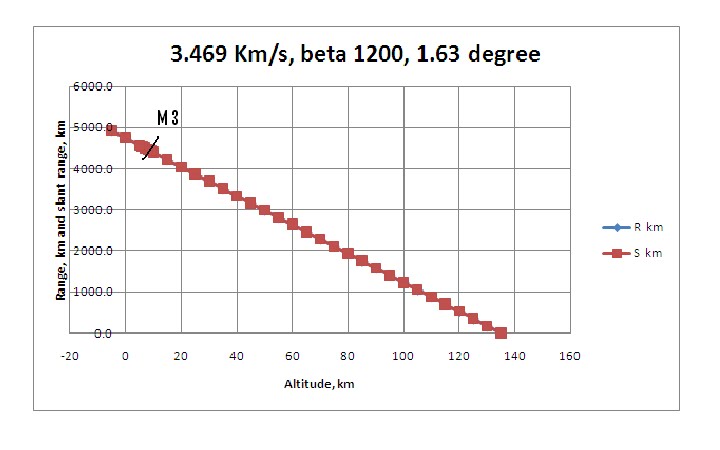
Figure 8 – Nominal Case Range and Slant Range vs Altitude

Figure 9 – Nominal Case Deceleration Gees vs Slant Range

Figure 10 – Nominal Case Heating vs Slant Range

Figure 11 – Spreadsheet Image for the “Plus 500” Case (1700 kg/sq.m, 1.63 degrees

Figure 12 – “Plus 500” Case Velocity vs Slant Range

Figure 13 – “Plus 500” Case Range and Slant Range vs Altitude

Figure 14 – “Plus 500” Case Deceleration Gees vs Slant Range

Figure 15 – “Plus 500” Case Heating vs Slant Range

Figure 16 – Spreadsheet Image for the “Minus 500” Case (700 kg/sq.m, 1.63 degrees)

Figure 17 – “Minus 500” Case Velocity vs Slant Range

Figure 18 – “Minus 500” Case Range and Slant Range vs Altitude

Figure 19 – “Minus 500” Case Deceleration Gees vs Slant Range

Figure 20 – “Minus 500” Case Heating vs Slant Range

Figure 21 – Spreadsheet Image for the “Big De-Orbit Burn” Case (1200 kg/sq.m, 6.4 degrees)

Figure 22 – “Big De-Orbit Burn” Case Velocity vs Slant Range

Figure 23 – “Big De-Orbit Burn” Case Range and Slant Range vs Altitude

Figure 24 – “Big De-Orbit Burn” Case Deceleration Gees vs Slant Range

Figure 25 – “Big De-Orbit Burn” Case Heating vs Slant Range

No comments:
Post a Comment